Showing posts with label System Analysis and Design. Show all posts

Sunday, April 22, 2012

How to draw UML Activity Diagrams?

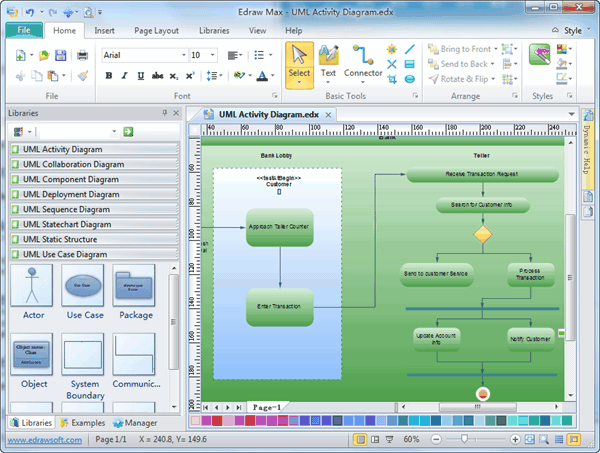
UML Activity Diagrams is a special case of a statechart diagram in which all of the states are action states and the transitions are triggered by the completion of actions in the source state. Use an activity diagram to describe the internal behavior of a method and represent a flow driven by internally generated actions. 


UML Activity Diagram Symbols


How to draw UML activity diagrams

1. Identify the scope of the activity diagram

Begin by identifying what it is you are modeling. Is it a single use case? A portion of a use case? A business process that includes several use cases? A single method of a class? Once you identify the scope of your diagram, you should add a label at the top, using a note, indicating an appropriate title for the diagram and a unique identifier for it. You may also want to include the date and even the names of the authors of the diagram.

2. Add start and end points

Every activity diagram has a starting point and an ending point, so you might as well add them right away. In UML Distilled (see Resources), Fowler and Scott make ending points optional. Sometimes an activity is simply a dead end but, if this is the case, then there is no harm in indicating the only transition is to an ending point. This way, when someone else reads your diagram, he or she knows you have considered how to exit these activities.

3. Add activities

If you are modeling a use case, introduce an activity for each major step initiated by an actor (this activity would include the initial step, plus any steps describing the response of the system to the initial step). If you are modeling a high-level business process, introduce an activity for each major process, often a use case or a package of use cases. Finally, if you are modeling a method, then it is common to have an activity for this step in the code.

4. Add transitions from the activities

My style is always to exit an activity, even if it is simply to an ending point. Whenever there is more than one transition out of an activity, you must label each transition appropriately.

5. Add decision points

Sometimes the logic of what you are modeling calls for a decision to be made. Perhaps something needs to be inspected or compared to something else. Important to note is that the use of decision points is optional. For example, in Figure 1 I could just as easily have modeled the accepted and rejected transitions straight out of the "Enroll in University" activity.

6. Identify opportunities for parallel activities

Two activities can occur in parallel when no direct relationship exists between them and they must both finish before a third activity can. In Figure 1 you see it is possible to attend the overview or enroll in seminars in either order, but both activities must occur before you can end the overall process.

Thursday, October 13, 2011

Entity relationship diagram and Normalization of Airline Reservation System - a good example


E-R DIAGRAM :
E-R Diagram constitute a technique for representing the logical structure of a database in a pictorial manner. This analysis is then used to organize data as a relation, normalising relation and finally obtaining a relation database.

Entities : Which specify distinct real-world items in an application.
Properties (or): Which specify properties of an entity and relationships.
Relationships : Which connect entities and represent meaningful dependencies between them.


NORMALIZATION :
The basic objective of normalization is to be reduce redundancy which means that information is to be stored only once. Storing information several times leads to wastage of storage space and increase in the total size of the data stored.

If a Database is not properly designed it can gives rise to modification anomalies. Modification anomalies arise when data is added to, changed or deleted from a database table. Similarly, in traditional databases as well as improperly designed relational databases, data redundancy can be a problem. These can be eliminated by normalizing a database.

Normalization is the process of breaking down a table into smaller tables. So that each table deals with a single theme. There are three different kinds of modifications of anomalies and formulated the first, second and third normal forms (3NF) is considered sufficient for most practical purposes. It should be considered only after a through analysis and complete understanding of its implications.

FIRST NORMAL FORM (1NF) :
This form also called as a “flat file”. Each column should contain data in respect of a single attributes and no two rows may be identical.
To bring a table to First Normal Form, repeating groups of fields should be identified and moved to another table.

SECOND NORMAL FORM (2NF) :
A relation is said to be in 2NF if it is 1NF and non-key attributes are functionality dependent on the key attributes. A ‘Functional Dependency’ is a relationship among attributes. One attribute is said to be functionally dependent on another if the value of the first attribute depends on the value of the second attribute.
In the given description flight number and halt code is the composite key.

Splitting of relation given in table 1 into 2NF relations

FLIGHT DETAILS :
AR_FLIGHT_MST
FL_NOVARCHAR2(7)PRIMARY KEY
FL_NAMEVARCHAR2(25)NOT NULL
ORG_CDNUMBER(3)NOT NULL
DES_CDNUMBER(3)NOT NULL
CAPACITYNUMBER(3)NOT NULL
AR_FLIGHT_DET
FL_NOVARCHAR2(7)PRIMARY KEY (REFERENCE AR_FLIGHT_MST.FL_NO)
HALT_CDNUMBER(3)PRIMARY KEY
DIST_FRM_ORGNUMBER(3)-
NO_QUOTANUMBER(3)-
NO_BOOKEDNUMBER(3) -
JOUR_DATE-NOT NULL
THIRD NORMAL FORM (3NF) :
A Third Normal Form normalization will be needed where all attributes in a relation tuple are not functionally dependent only on the key attribute. A transitive dependency is one in which one in which one attribute depends on second which is turned depends on a third and so on.
FLIGHT DETAILS :
AR_FLIGHT_MST
FL_NOVARCHAR2(7)PRIMARY KEY
FL_NAMEVARCHAR2(25)NOT NULL
ORG_CDNUMBER(3)NOT NULL
DES_CDNUMBER(3)NOT NULL
CAPACITYNUMBER(3)NOT NULL
AR_FLIGHT_DET
FL_NOVARCHAR2(7)PRIMARY KEY (REFERENCE AR_FLIGHT_MST.FL_NO)
HALT_CDNUMBER(3)PRIMARY KEY
DIST_FRM_ORGNUMBER(3)-
NO_QUOTANUMBER(3)-
NO_BOOKEDNUMBER(3-
JOUR_DATE-NOT NULL
AR_HALT_MST
HALT_CDNUMBER(3)PRIMARY KEY
DESCRIPTIONVARCHAR2(30)NOT NULL

Relational model for Airline Reservation System

A distribution Airline Reservation System stores the following information 
(The following description may lead to un-normalized relations normalize them whenever required).

The flight details 
It includes the originating flight terminal and destination terminal, along with stops in between, number of seats booked/available seats between two destination etc.

Customer Description 
It includes customer code, name, address and phone number. This information may be used for keeping the records of customer for any emergency or for any other kind of information

Reservation Description 
It includes customer code number, flight number, date of booking, date of traveling, (You may assume any other fild/relation, if needed). 

Let us assume that this distributed system is to be used following application:

a. A request for booking/cancellation of flight from any source to any destination
, giving connected flights in case no direct flight between the specified Source-Destination pair exist.

b. Calculation of high fliers (most frequent fliers) and calculating appropriate 
reward points for these fliers.

Assuming both the transactions are single transactions. Design a distributed database that is geographically dispersed at four cites Delhi, Mumbai, Chennai, Kolkatta) Make suitable assumptions. Give justifications to your design.
Your design include:

i) The global schema, fragmentation schema, allocation schema.

ii) SQL commands for above queries/applications

iii) How the response for application 1 and 2 will be generated. Assuming these 
are global queries. Explain how various fragments will be combined to do so.

iv) Implement the database at least using a centralized database management 
system (make suitable adjustment in your design)

Answer:

DISTRIBUTED DATABASE :

Distributed database implies that a single application should be able to operate transparently on data that is spread across a variety of different databases and connected by a communication network.

“A distributed database system consists of a collection of ‘sites’, connected together
via some kind of communications network, in which

1. Each site is a database system site in its own right, but

2. The sites have agreed to work together so that a user at any site can access data anywhere in the network exactly as if the data were all stored at the user’s own site.

It follows that the so-called “distributed database” is really a kind of virtual objects, whose component parts are physically stored in a number of distinct “real” database at a number distinct sites.

A distributed database system consists of a collection of sites, each of which may participate in the execution of transactions which access data at one site, or several sites. The main difference between centralized and distributed database systems is that, in the former, the data resided in one single location, while in the latter, the data resided in several locations.

Each site is able to process local transactions, those transactions that access data only that single site. A site may participate in the executions of global transactions, those transactions that access data in several sites. The execution of global transactions require communication among the sites.

Each site is a database system site in its own right. In other words, each site has its own local “real” databases, its own local users, its own local DBMS and transaction management software and its own local data communications manager. The distributed database system can thus be regarded as a kind of partnership among individual local DBMS at the individual sites.

In the given context there are four sites,i.e., Delhi, Mumbai, Chennai and Kolkata and these sites are geographically dispersed. Each site has its own computer with a database consisting of all the customers and flight details maintained at that site. The database system at the various sites are based on the relational model. Each branch maintains the relation reservation where

Reservation_scheme=(site_code,fl_no,cust_code,travel_date)

Site containing information about the four sites maintains the relation (Cite_scheme), where

Cite_scheme=(Cite_code,Cite_name)

A local transaction is a transaction that accesses information in the one single site, at which the transaction was initiated. A global transaction, on the other hand is one which either access accounts in a site different from the one at which the transaction was initiated, or access several different sites.

Then the advantages are surely obvious: The distributed arrangement combines efficiency of processing (the data is stored close to the point where it is most frequently used) with increased accessibility (it is possible to access a Delhi information from Kolkata and vice versa, via the communication network), reliability and availability and speedup of query processing.

Allowing the structure of the database to mirror the structure of the enterprise is probably the number one advantage of distributed systems. There are some disadvantages too, of which the biggest is the fact that distributed systems are complex, software development cost, greater potential for bugs and increase processing overhead.

As per commercial implementations, most of today’s relational products offer some kind of distributed database support. Some of the best known include,

(a) INRESS/STAR , from The ASK Group Inc.’s Ingress Division;

(b) the distributed database option of ORCALE8 or later from Oracle Corporation and

(c) the distributed data facility of DB2 from IBM.

It is worth pointing out that all of the systems listed above, both prototypes and products, are relational.

OBJECTIVES :

1. Local autonomy

2. No reliance on a central site

3. Continuous operation

4. Location independence

5. Fragmentation independence

6. Replication independence

7. Distributed query processing

8. Distributed transactions management

9. Hardware independence

10. Operating system independence

11. Network independence

12. DBMS independence

These above twelve objectives are not all independent of one another, nor are they necessarily exhaustive, nor are they all equally significant. However, they are useful as a basis for understanding distributed technology and as a framework for characterizing the functionality of specific distributed systems.

Monday, October 10, 2011

Entity Relational Modeling vs. Dimensional Modeling

Surrogate Keys
  • A substitution for the natural primary key.
  • It is just a unique identifier or number for each row that can be used for the primary key to the table. The only requirement for a surrogate primary key is that it is unique for each row in the table.
  • Data warehouses typically use a surrogate, (also known as artificial or identity key), key for the dimension tables primary keys. They can use Oracle sequence, or SQL Server Identity values for the surrogate key.
  • It is useful because the natural primary key (i.e. Customer Number in Customer table) can change and this makes updates more difficult.
  • In a data warehouse, a surrogate key is a necessary generalization of the natural production key and is one of the basic elements of data warehouse design.
  • Every join between dimension tables and fact tables in a data warehouse environment should be based on surrogate keys, not natural keys.
  • It is up to the data extract logic to systematically look up and replace every incoming natural key with a data warehouse surrogate key each time either a dimension record or a fact record is brought into the data warehouse environment.
  • One of the most important use of surrogate Key the need to encode uncertain knowledge (When you have a I don't know" situation, you may want more than just this one special key for the anonymous customer )


ER to Dimensional modeling

Single Entity Relationship – breaks down into multiple Facts
  1. Convert ER to set of dimensional modeling
  2. Select many-to-many facts
  3. De-normalize remaining tables

Monday, May 16, 2011

Difference between Use Case Diagram and Data Flow Diagram?

Data Flow Diagram :
  • A data flow diagram is a graphic representation of a system or portion of system. It consists of data flows, processes, sources, destinations, and stores – all described through the use of easily understood symbols. An entire system can be described from the viewpoint of the data it processes with only four symbol. At the same time, data flow diagrams are powerful enough to show parallel activities. When standard symbols limit communication, a presentation graph, which uses symbols of people, files, terminals, and documents, can be used to discuss a system with users.
A data flow diagram are of two types :

· Physical Data flow diagrams
· Logical data flow diagrams.


Physical data flow diagrams are implementation-dependent. They show the actual devices, department, people, etc., involved in the current system.

Logical data flow diagrams, in contrast, describe the system independently of how it is actually implemented; that is, they show what takes place, rather than how an activity is accomplished.

Both types of data flow diagrams support a top-down approach to systems analysis, whereby analysts begin by developing a general understanding of the system and gradually explode components in greater detail. As details are added, information about control can also be included, although upper-level general diagrams are drawn without showing specific control issues to ensure focuses on data and processes.


Rules for drawing Logical Data Flow Diagrams :
  1. Any data flow leaving a process must be based on data that are input to the process.
  2. All data flows are named; the name reflects the data flowing between processes, data stores, sources, or sinks.
  3. Only data needed to perform the process should be an input to the process.
  4. A process should know nothing about, that is, be independent of, any other process in the system, it should depend only on its own input and output.
  5. Processes are always running, they do now start or stop. Analysts should assume that a process is always ready to function or perform necessary work.
  6. Output from processes can take one of the following forms :
a. An input data flow with information added by the process (for example, an annoted invoice)
b. A response or change of data form (such as change of profit dollars into profit percentage)
c. Change of status (from unapproved to approved status)
d. Change of content (assembly or separation of information contained in one or more incoming
data flows)
e. Change in organization (for example, the physical separation or rearrangement of data)

Example of Data flow diagram


When beginning a systems study in an unfamiliar area, you need to get the lay of the land. Physical elements stand out first: the people, reports and documents, file cabinets and in-baskets, and events. It’s not unusual to remember certain key people or places. Physical data flow diagrams depict these physical elements.
Once you have the lay of the land, the essentials of a task can be studied more carefully. You need to get below the surface, so to speak. That’s what logical data flow diagrams are all about.
Logical data flow diagrams describe data, processes, and events differently. They are more abstract than physical data flow diagrams, but that difference is important. As an analyst, you have to know more about the job that must be done than the people who are actually doing the work. This doesn’t mean that people are not important, for they surely are. But if a key worker becomes ill or chooses to leave the company, the work will remain. Desks, files and computers will change, too. By focusing on the understanding elements – the logical, nonphysical aspects – you gain an understanding of the fundamental structure of the system. Only then can you develop a complete understanding and form a basis for designing the right system.


Use Case Diagram : 

A user case diagram shows you some of the use cases in your system, some of the actors in your system, and the relationships between them. A use case is a high- level piece of functionality that the system will provide. An actor is anyone or anything that interacts with the system being built.

An example of use case diagram
In the above diagram, there are three actors: the customer, the bank officer, and the credit system. There are six major pieces of functionality the system will provide: depositing funds, transferring funds, withdrawing money, changing a PIN, viewing a balance, and making a payment.
One of the major benefits of a Use Case diagrams is communication. Your customers can look at this diagram and receive a great deal of information. By looking at the use cases, they will know what functionality will be included in the system. By looking at the actors, they will know exactly who will be interfacing with the system. By looking at the set of use cases and actors, they will know exactly what the scope of the project will be. This can help them identify up front any missing functionality.